Media statements
NZ Super Fund posts best ever annual return
POSTED ON: 14 September 2021
Share:
The NZ Super Fund has posted its strongest ever annual return of 29.63 percent, ending the 2020/21 financial year at $59.8 billion, an increase of $15 billion over the 12 months.*
CEO Matt Whineray says the result is an exceptional one for the Fund, which was set up in 2001 to create a Government nest-egg to help pay for future universal superannuation costs.
“This past year demonstrates the importance of sticking to our long-term investment strategies, which are designed to play out through market cycles. The Fund has a portfolio mix that was well positioned to capture strong returns from rising asset values over the year.”
“The Government is projected to start making withdrawals from the Fund to help pay for superannuation from the mid-2030s, and the Fund is forecast to continue to grow as a percentage of GDP through 2070. Given that time horizon, we’ve built a growth-oriented portfolio that will generate strong returns over the long term and performs strongly in periods of market expansion.”
The Fund exceeded the Treasury Bill return (the Government’s cost of debt) by $13.02 billion (29.39 percent). The Fund also beat its benchmark low cost indexed Reference Portfolio by $757 million (1.73 percent), an achievement Mr Whineray says is very pleasing given the strong performance of global listed equity markets over the year.
The net contributions from the Government of $12.4 billion have now grown into a $59.8 billion nest egg, ringfenced to support future superannuation payments.
Following balance date, a $1.9 billion tax payment by the Fund to the Government for the 2020/21 financial year has seen the Fund’s value drop slightly since 30 June. While the Fund pays New Zealand tax (and is regularly one of New Zealand’s largest taxpayers), its funding model means that over time Government contributions tend to offset tax paid. Government contributions to the Fund over 2020/21 were $2.1 billion. Total NZ tax paid by the Fund in respect of the 2020/21 year was $2.3 billion.
Performance since inception
In the nearly 18 years since investing began in 2003, the Fund has returned 10.67 percent per annum (after costs, before NZ tax). It has exceeded the 90-day Treasury Bill return by 7.14 percent per annum, or $39.1 billion, and the Reference Portfolio by 1.24 percent per annum.
Mr Whineray says these are world class results that show the Guardians has been successful in utilising the Fund’s long horizon, operational independence, sovereign status and strong governance structures in order to generate above-market returns over a sustained period.
“What this means is that the team has added $10.6 billion of value above what would’ve been achieved with a simple, market indexed, passive portfolio. This is achieved by active investment strategies that leverage our endowments, such as our strategic tilting programme, private market assets and credit & funding investments.”
Future Focus
“With markets continuing to perform strongly and economies rebounding, supported by accommodative fiscal and monetary policy around the world, we’re possibly looking at a period of increasing inflation and rising interest rates. That combination should weigh on company returns and creates a challenging investment environment. We do not expect the outperformance of recent times to continue forever,” says Mr Whineray.
“At the same time, the ongoing impact of Covid-19 and uncertainty about virus variants weighs on economic sentiment. It’s a recipe for ongoing uncertainty we aim to tackle by focusing on the long-term performance of the Fund.”
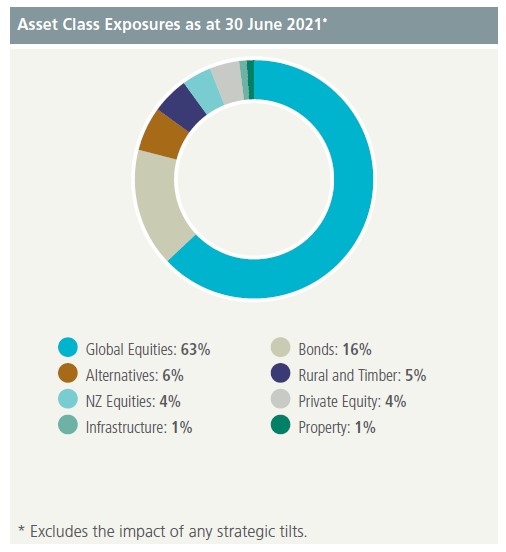
What’s in the nest egg
Broken down into asset classes, the NZ Super Fund’s net asset position is comprised of**:
- Global equities 63%
- Bonds 16%
- NZ equities 4%
- Rural land and timber 5%
- Alternatives 6%
- Private equity 4%
- Infrastructure 1%
- Property 1%
The Fund’s New Zealand investments include stakes in Kaingaroa Timberlands, Kiwibank, Datacom, LabTests, Fidelity Life, $2.5 billion in listed equities and a range of investments in property, farmland and small-medium size growth companies.
*Fund performance figures are reported on a provisional basis and are subject to finalisation through normal end of year processes. All figures are reported after costs and before NZ tax.
** Excludes the impact of strategic tilts